Dabeaz
Dave Beazley's mondo computer blog. [ homepage | archive ]Tuesday, January 05, 2010
The Python GIL Visualized
In preparation for my upcoming PyCON'2010 talk on "Understanding the Python GIL", I've been working on a variety of new material--including some graphical visualization of the GIL behavior described in my earlier talk. I'm still experimenting, but check it out.
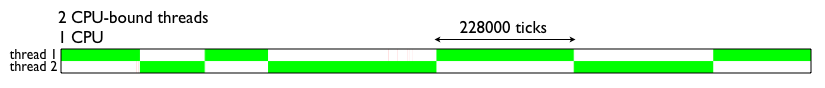
In these graphs, Python interpreter ticks are shown along the X-axis. The two bars indicate two different threads that are executing. White regions indicate times at which a thread is completely idle. Green regions indicate when a thread holds the GIL and is running. Red regions indicate when a thread has been scheduled by the operating system only to awake and find that the GIL is not available (e.g., the infamous "GIL Battle"). For those who don't want to read, here is the legend again in pictures:

Okay, now let's look at some threads. First, here is the behavior of running two CPU-bound threads on a single CPU system. As you will observe, the threads nicely alternate with each other after long periods of computation.
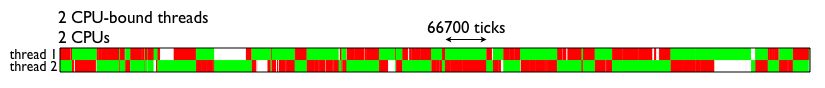
Now, let's go fire up the code on your fancy new dual-core laptop. Yow! Look at all of that GIL contention. Again, all of those red regions indicate times where the operating system has scheduled a Python thread on one of the cores, but it can't run because the thread on the other core is holding it.
Here's an interesting case that involves an I/O bound thread competing with a CPU-bound thread. In this example, the I/O thread merely echoes UDP packets. Here is the code for that thread.
def thread_1(port):
    s = socket(AF_INET,SOCK_DGRAM)
    s.bind(("",port))
    while True:
        msg, addr = s.recvfrom(1024)
        s.sendto(msg,addr)
The other thread (thread 2) is just mindlessly spinning. This graph shows what happens when you send a UDP message to thread 1.
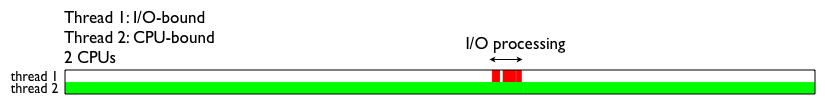
As you would expect, most of the time is spent running the CPU-bound thread. However, when I/O is received, there is a flurry of activity that takes place in the I/O thread. Let's zoom in on that region and see what's happening.
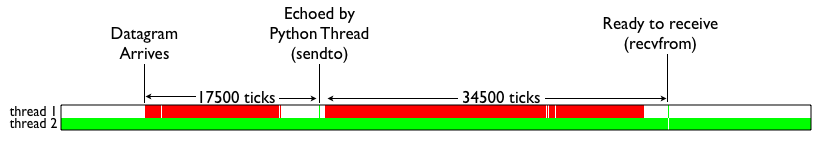
In this graph, you're seeing how difficult it is for the I/O bound to get the GIL in order to perform its small amount of processing. For instance, approximately 17000 interpreter ticks pass between the arrival of the UDP message and successful return of the s.recvfrom() call (and notice all of the GIL contention). More that 34000 ticks pass between the execution of s.sendto() and looping back to the next s.recvfrom() call. Needless to say, this is not the behavior you usually want for I/O bound processing.
Anyways, that is all for now. Come to my PyCON talk to see much more. Also check out Antoine Pitrou's work on a new GIL.
Note: It is not too late to sign up for my Concurrency Workshop next week (Jan 14-15).
Archives
08/01/2009 - 09/01/2009 09/01/2009 - 10/01/2009 10/01/2009 - 11/01/2009 11/01/2009 - 12/01/2009 12/01/2009 - 01/01/2010 01/01/2010 - 02/01/2010 02/01/2010 - 03/01/2010 04/01/2010 - 05/01/2010 05/01/2010 - 06/01/2010 07/01/2010 - 08/01/2010 08/01/2010 - 09/01/2010 09/01/2010 - 10/01/2010 12/01/2010 - 01/01/2011 01/01/2011 - 02/01/2011 02/01/2011 - 03/01/2011 03/01/2011 - 04/01/2011 04/01/2011 - 05/01/2011 05/01/2011 - 06/01/2011 08/01/2011 - 09/01/2011 09/01/2011 - 10/01/2011 12/01/2011 - 01/01/2012 01/01/2012 - 02/01/2012 02/01/2012 - 03/01/2012 03/01/2012 - 04/01/2012 07/01/2012 - 08/01/2012 01/01/2013 - 02/01/2013 03/01/2013 - 04/01/2013 06/01/2014 - 07/01/2014 09/01/2014 - 10/01/2014
![]()
Subscribe to Comments [Atom]